
Ingredient Table with the Venn diagram, photograph model, and the two kinds of sugar included in the chocolate chip cookie recipe.

Full length of the Ingredient Table.

Detail of the photographic diagram and chocolate chip cookie ingredients.
The following four models, topographic map, Venn diagram, data tree and a photograph were used on the Ingredient Table Project. I applied each model's form and structure to the chocolate chip cookie recipe, expanding upon the traditional use of each model by applying a non-traditional data set. Each information graphic model is usable and provides a unique perspective upon the various ways to visualize a single data set.

Topographic map representing the chocolate chip cookie recipe - Ingredient Table information graphic.

Venn digram visualizing the chocolate chip cookie recipe - Ingredient Table information graphic.
Data tree visualization presenting the chocolate chip cookie recipe - Ingredient Table information graphic.
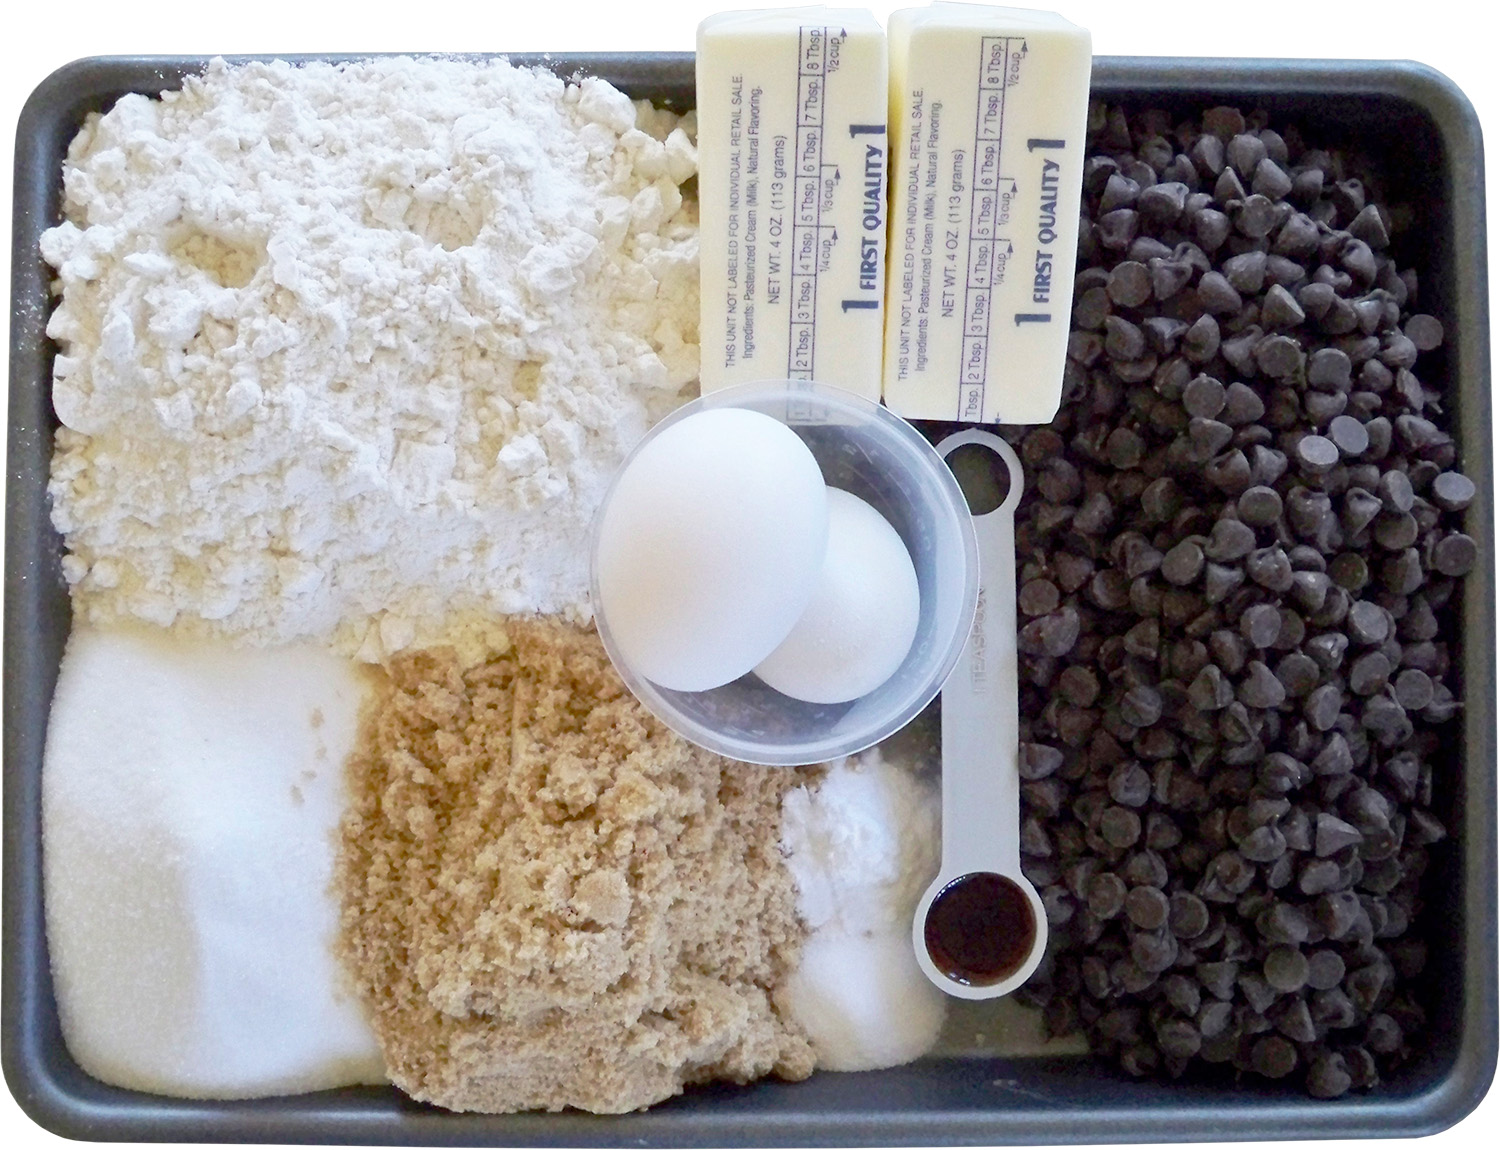
Photographic presentation of my data set, the chocolate chip cookie recipe - Ingredient Table information graphic.
MFA Thesis Project
Information Graphic Models, Photography, Illustration, Typography
The second project of the thesis exhibition, the Ingredient Table, was comprised of two parts, a series of four information graphic models that conceptualized the chocolate chip cookie recipe, and all the actual ingredients listed in the recipe itself. The information graphic models and the ingredients were displayed on a table inside the exhibition space.
In an effort to explore and expand upon various information graphic models my intentions were to provide my audience with directly comparative examples of the application of information graphics. The measured chocolate chip cookie ingredients were displayed along side information graphics that transformed the recipe's text into visualizations. The models included in the project were a topographic map, Venn diagram, photographic image, and a data tree.
The table was covered in a single piece of printed vinyl. Text and all the graphic models were printed while the chocolate chip cookie ingredients were displayed on the table's surface for the duration of the exhibition.
96"x15"
printed vinyl